Churn Prediction & CLV Calculation in Sitecore CDP Segments.
Did you know that in Sitecore CDP, you can use Machine Learning algorithms and statistical analysis without any 3rd party services?
In this article, we'll delve into the less-explored features of user segmentation within Sitecore CDP, utilizing the powerful Advanced SQL mode. You might wonder, "What sets the Advanced SQL mode apart from the standard mode?" Well, the key advantage lies in its access to comprehensive user databases, complete with their entire historical data – a treasure trove for a wide array of Machine Learning tasks, encompassing clustering algorithms, collaborative filtering, and the calculation of customer lifetime value, among others.
To illustrate this, let's walk through an example involving the determination of Customer Lifetime Value (CLV) for users, and our main goal will be "Customer Churn Prediction: Identifying and Taking Action."
However, before we dive into practical examples, we'll lay down some foundational theory to grasp the core principles and methods for tackling such tasks. (you can skip this section if you are famuliar with CLV and RFM analysis)
What is Churn prediction?
Predicting customer churn involves identifying users who are likely to discontinue their use of a service or terminate their subscription. It's a pivotal prediction for businesses since acquiring new customers often incurs higher costs than retaining existing ones.
Why is it so important?
Customer churn is a pervasive challenge across industries. Growing as a company necessitates investing in acquiring new customers. Each departure represents a substantial loss of investment, requiring both time and effort to replace. Predicting when a customer might leave and offering incentives to keep them can result in substantial savings for a business.
Therefore, gaining insight into customer engagement is highly valuable. It allows you to refine retention strategies and implement operational practices aimed at preventing customer attrition.
Churn prediction is a fundamental aspect of any businesses, and even slight fluctuations in churn rates can significantly impact the bottom line.
What are the key challenges?
Churn prediction models aim to discern the precise customer behaviors and attributes that indicate the risk and timing of customer departures. While the concept of proactive retention seems straightforward, it involves several challenges:
- Proactive Engagement: To succeed in retaining customers on the brink of leaving, marketers and customer success experts must predict in advance which customers are likely to churn and devise a tailored plan of marketing actions for maximum retention impact.
- Accuracy Matters: The accuracy of the churn prediction technique is critical. Without awareness of a customer about to churn, no action can be taken to retain them.
- Real-Time Data: Churn prediction models should rely on (almost) real-time data to assess the risk of churning, not static data. While static data can identify some at-risk customers, the predictions will lack accuracy.
What are the possible solutions?
To keep it concise, let's sort potential solutions into two categories:
- Utilizing supervised machine learning.
- Utilizing unsupervised machine learning.
The first approach demands a labeled dataset with clear indications of "churned" users. However, this is seldom feasible in practice due to the need for manual dataset labeling, making it an impractical option. The second approach is more prevalent, offering various methods to choose from. We'll opt for one of the most commonly employed techniques: understanding and applying Customer Lifetime Value (CLV).
One of the most common CLV-based techniques for addressing this problem is RFM analysis.
What is RFM?
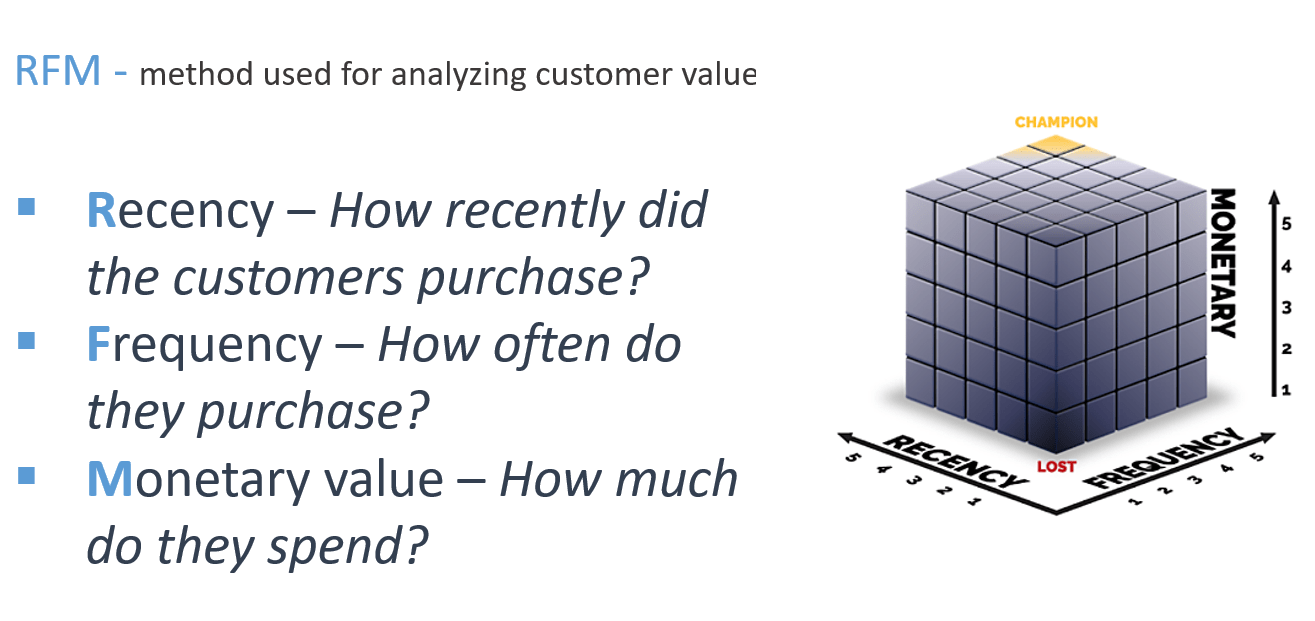
RFM is the number one marketing strategy for segmenting customers using data you already have. This analysis method evaluates customer spending patterns across three areas: recency, frequency, and monetary value. These RFM metrics are important indicators of a customer’s behavior because frequency and monetary value affects a customer’s lifetime value, and recency affects retention, a measure of engagement.
Your entire customer base is effectively assessed across three dimensions like this:
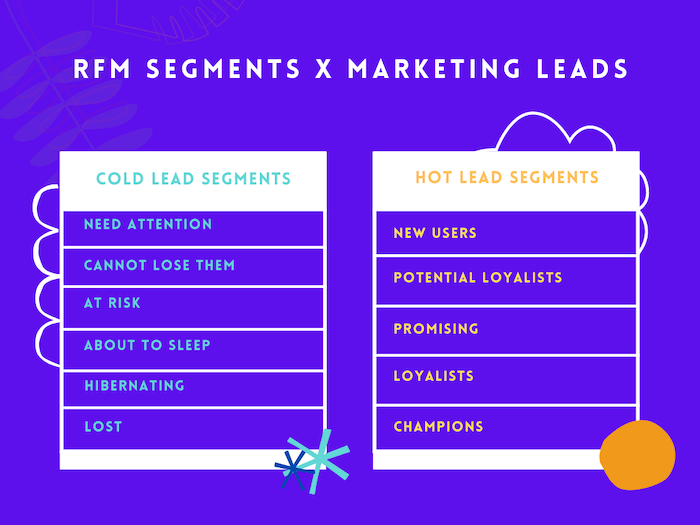
- Recency: Measures how recently users performed the purchase within the selected time frame. It's measured in days where a score of between 1 to 5 can be understood as Least Recently to Most Recently. When predicting RFM segments, users with the lowest scores are grouped into Cold Lead Segments (churned/ at risk of leaving) and vice versa. Cold Segments broadly indicate that if your existing engagement strategy remains unchanged, these users will eventually abandon your brand.
- Frequency: Measures how frequently users performed the purchase within the specified time frame. It's measured as the total number of times the event (purchase) was performed where a score of 1 to 5 can be understood as Performed Event (purchase) At least Once to Highest Number of Times. When predicting RFM segments, users with the highest score are grouped into Hot Lead Segments (brand champions, potential loyalists), and vice versa. Hot Segments broadly indicate highly engaged users who have a promising affinity towards your brand and are very likely to become long-term customers. These are low-hanging fruits that you can easily leverage to drive those revenue metrics!
- Monetary value: Measures how much users spent when they performed the purchase within the selected time frame. Here, a score of 1 to 5 can be understood as Lowest Purchase Value to Highest Purchase Value. Depending on how a user scores against R and F, they can be grouped into Hot Lead Segments or Cold Lead Segments. Why? Because in the real world, a recent (or frequent) mid-value purchaser is a lot more valuable than a high-spender who hasn't interacted with your brand in a long-time.
But what do I mean by ranked 1-5? How do you calculate that ranking?
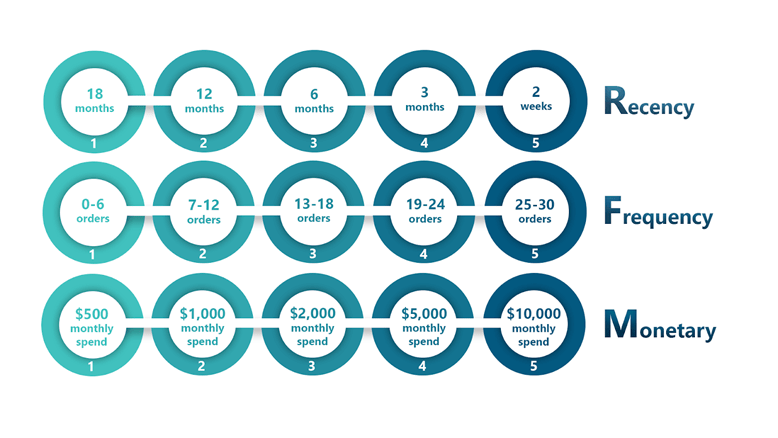
First, we analyze the customers we’ve got and work out sensible ranges for recency, frequency, and monetary value. Then, we split that into three or five equal buckets (5 in our case) - either equal in size or range of values, but it often works better if the buckets are an equal distribution of customers. We can then put each customer into one of those buckets and give them a score.
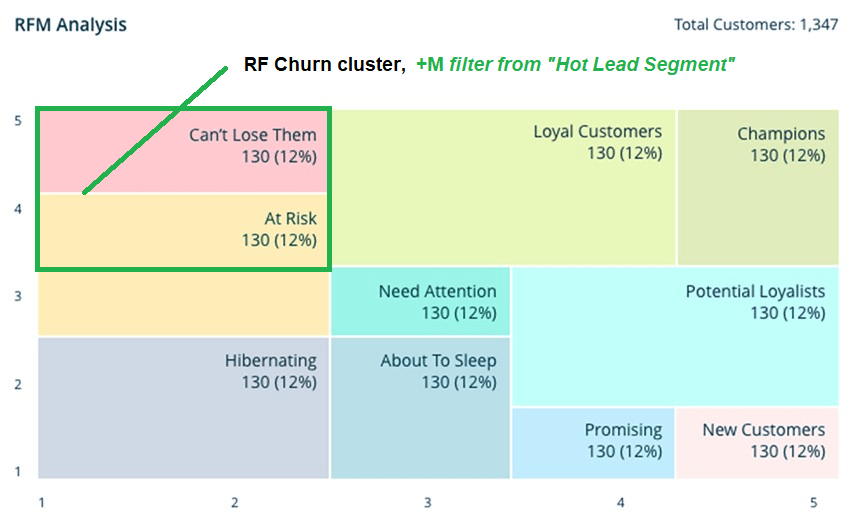
But just cluster numbers are not meaningful, so they are combined into segments of user behavioral groups. RFM analysis is usually visualized in a flatter, 2-dimensional image, making it much easier to understand.
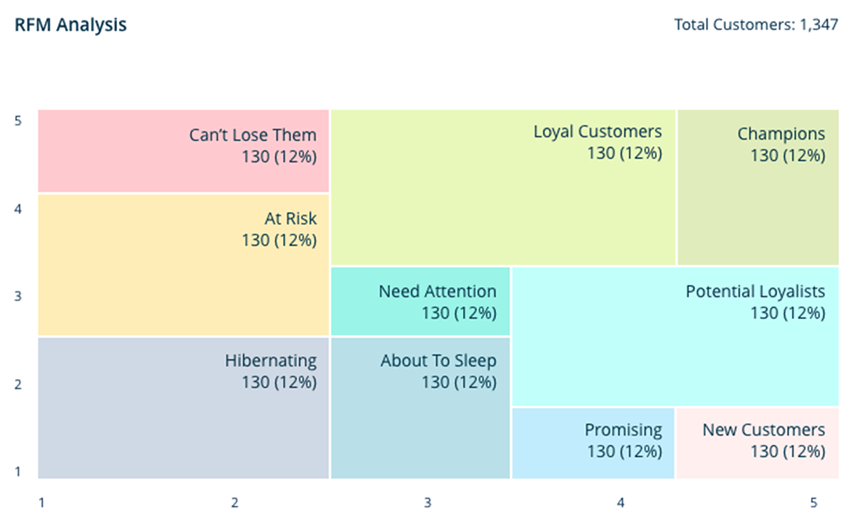
In a 2D visualization like the one above, new customers arrive at the bottom right as "New Customers", and if they begin to spend frequently with a decent value they rise quickly up to "Potential Loyalist", "Loyalist", and eventually become "Champions". But on the other hand, a "Loyal Customer" can drift into "Needs Attention" then "At Risk" if they begin to spend less often or haven’t ordered in a while.
Let's get back to predicting customer churn and get to the practical part.
Implement Churn prediction in Sitecore CDP.
To begin, let's decomposite the task of predicting customer churn (from simple to complex):
- Determine the clusters that will contain our churn customers.
- Identify where we can access the history of all users to calculate RFM segments.
- Write an algorithm for computing RFM.
- Test it.
Determine Churn cluster.
Within the Churn cluster, we group users from the "Can't Lose Them" and "At Risk" segments. Furthermore, for my specific project, we exclusively focus on users in the "Hot Segment" – those with the highest purchase value. However, for your project, you may not need to incorporate a monetary value filter. Hence, our Churn customer filter formula is as follows: Churn = R_segment<3 and F_segment>3 and M_segment>3.
Let me clarify the rationale for these specific criteria in my case and their potential adjustments based on business requirements. In my project, we don't aim to address all users at risk of churning. Instead, we concentrate on users with the highest purchase value who are most likely to churn if no action is taken. Our retention strategy for these users involves offering a substantial discount on their next purchase. Offering this discount to all risky users falling within the Churn category (including those with the lowest purchase value and At-Risk users with F=3) could lead to losses because marketing efforts do not guarantee user retention.
In a broader context, the filter formula can be simplified to Churn customers: Churn = R_segment < 3 and F_segment >= 3, encompassing users from the "Can't Lose Them" and "At Risk" segments. This approach is particularly applicable when your retention strategies for these users do not involve financial investments, such as email campaigns and similar methods.
Where we can access user history to calculate RFM segments in Sitecore CDP?
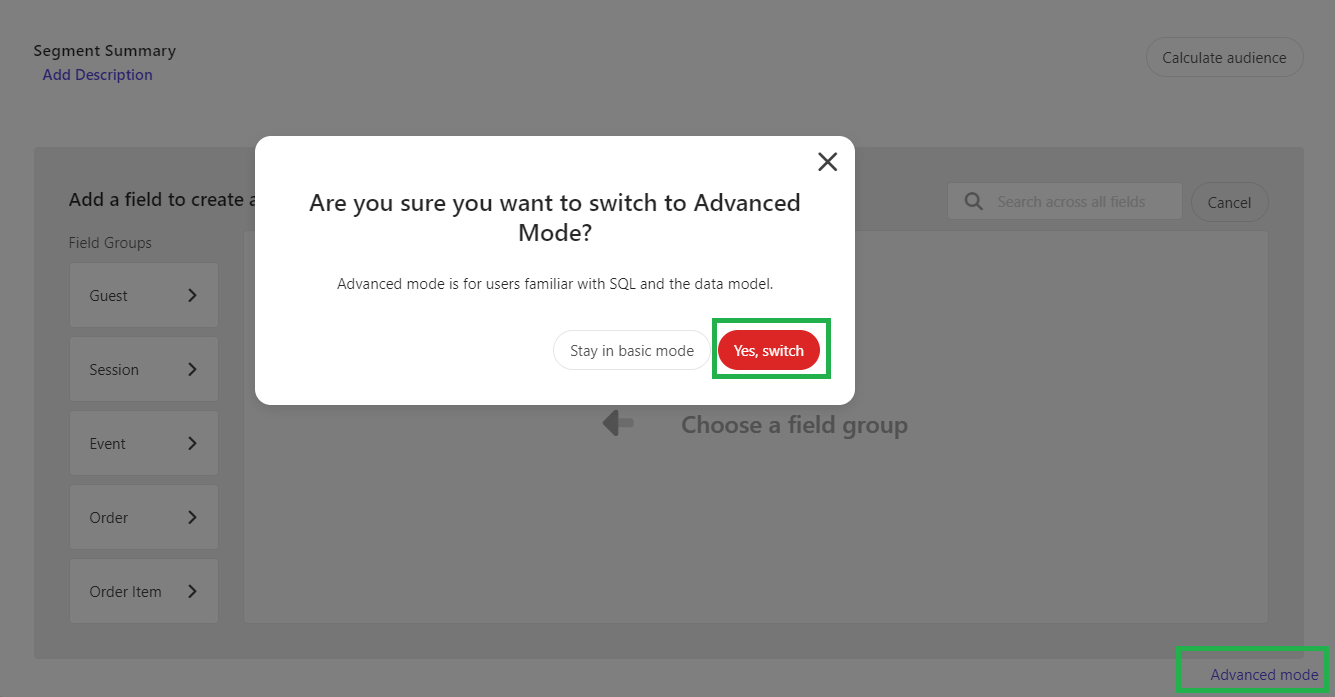
As you may have already guessed from the beginning of the article, we will be dealing with Sitecore CDP Batch Segments. This is quite evident since our challenge is segmentation task. However, in the regular Batch Segments Standard Mode, we won't be able to achieve anything similar or close to it. That's why we will be using the Advanced Mode, where we can write SQL queries ourselves.
An algorithm for computing RFM.
I will not describe how the RFM algorithm works, here is a picture, which basically makes everything clear:
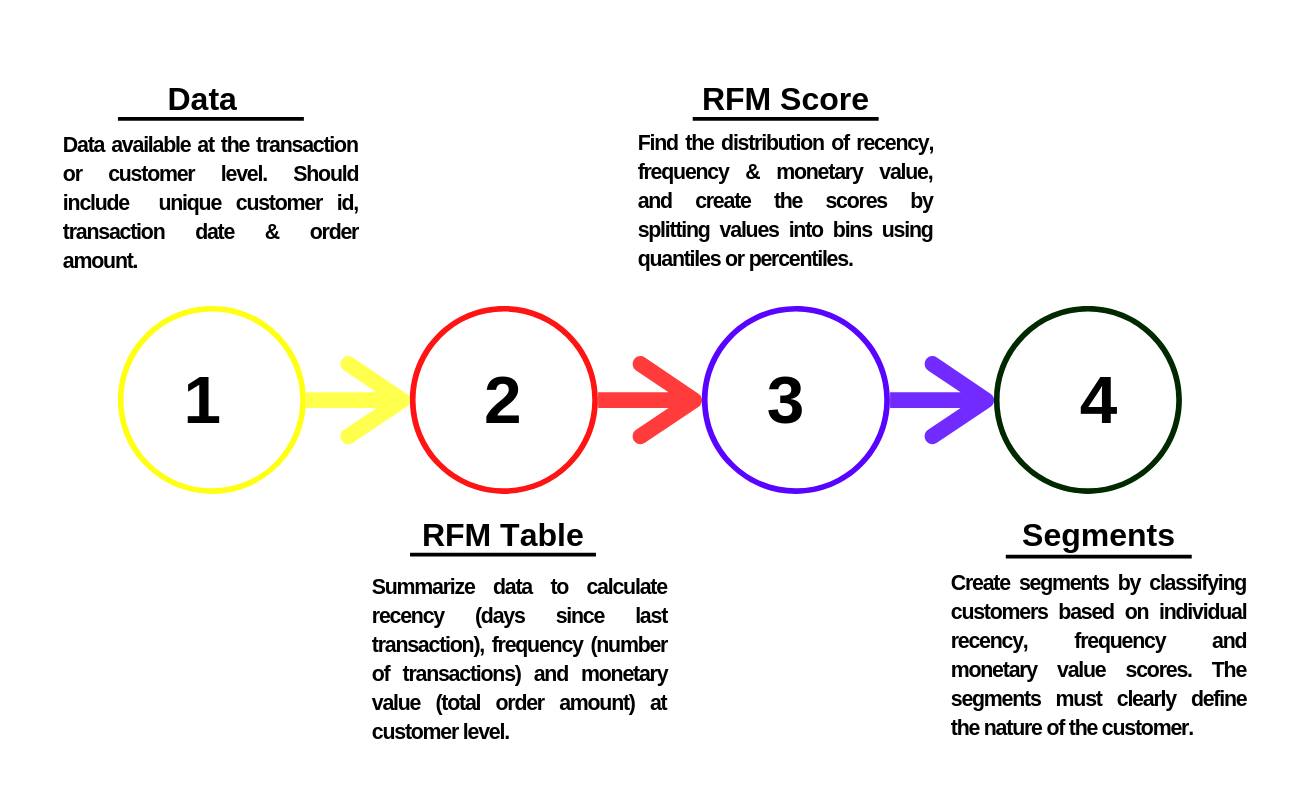
For Sitecore CDP Batch Segment we need to write this algorithm in SQL:
SELECT g.meta_ref as guest_ref
    FROM (
          SELECT o.meta_guest_ref,
            NTILE(5) OVER (ORDER BY R DESC) as R_S,
            NTILE(5) OVER (ORDER BY F ASC) as F_S,
            NTILE(5) OVER (ORDER BY F ASC) as M_S

          FROM (
             SELECT o.meta_guest_ref,
                     DATE_DIFF('day', max(date(core_ordered_at)), current_date) AS R,
                     COUNT(*) AS F,
                     SUM(o.core_price) AS M
             FROM orders o
             GROUP BY o.meta_guest_ref
           ) o
       )
    INNER JOIN guests g
      ON meta_guest_ref = g.meta_ref
    WHERE R_S<3 and F_S>3 and M_S>3
    GROUP BY g.meta_ref
Unfortunately, I couldn't find documentation on the SQL syntax for the Advanced Mode editor. However, through trial and error, I've determined that it closely resembles Presto SQL syntax. (If this is not the case, please let me know in the comments).
Validation.
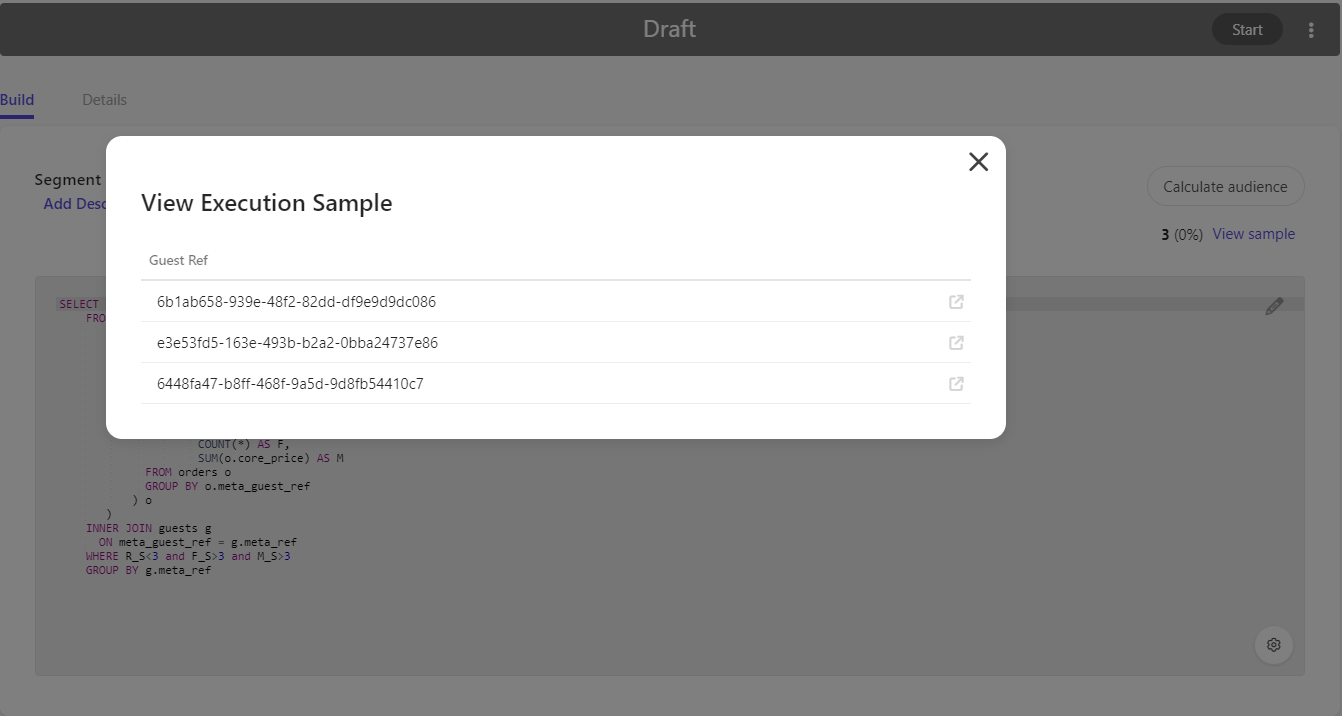
One last thing you should pay attention to: after running the code, make sure that the percentage of users who get into Churn segment is small, because churn by definition cannot be large (don't pay attention that there are only 3 users on my screenshot, it's just my test environment). Also, a word of advice: write, debugging and validation of code should be done on some test dataset locally in your SSMS, because in Sitecore CDP Batch editor you just can't see what's going on behind the scenes and it's very easy to make a mistake and simply not notice it.
Conclusion
As you could see, Sitecore CDP Batch Segments is quite a powerful tool for determining CLV of users, moreover, as you know, the segments are recalculated every day, so you will always have real-time data and can safely use it for your marketing campaigns. I omitted the calculations of normalized CLV_score and RFM_score in the article, because the article turned out to be bigger than I expected and they are not needed for Churn prediction. One more note: at this stage we can't track the statistics of user migration from one segment to another, since we don't store any values. But this is actually also easily solved by Sitecore CDP itself.
Looks interesting? Then keep an eye on my updates, I will soon have a meetup on hidden and undocumented features of Sitecore CDP.